NowFromTN:
Here is a good explanation and @Jman is correct, the JJ system is from 1991 and has been or being replaced by these
The Fitzgerald-Spielberger (FS) chart modernizes NFL draft pick valuation by focusing on rookie contract surplus value and on-field production (approximate value) to prioritize mid-round picks, while the Jimmy Johnson (JJ) system , created in 1991, heavily overvalues top-10 picks and is based on historical trade sentiment rather than current statistical analysis
But it DOES take into account player position and contract value, as well as 2nd contract value… It’s puts a MUCH higher value on later round picks.
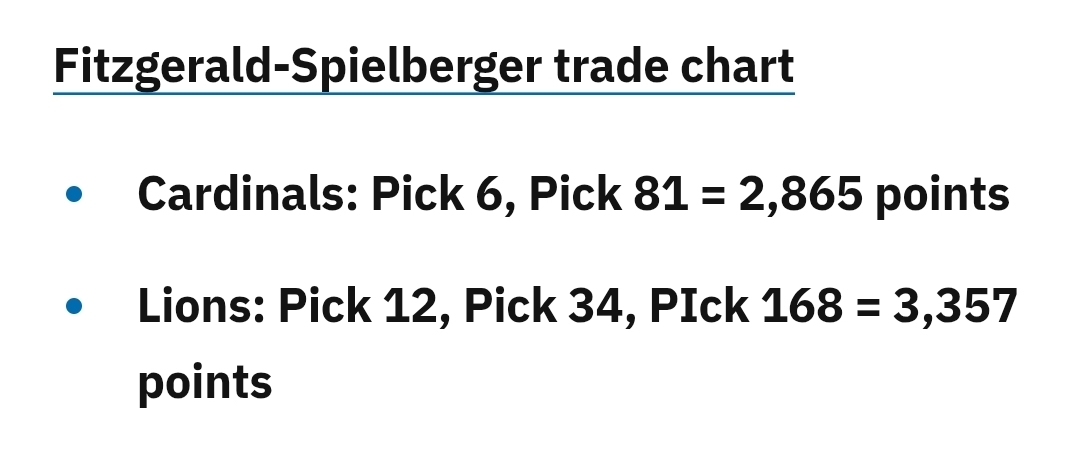
Here’s their value on the Lions/Cardinals trade in 2023…
Huge value gap in that chart
OK, so does that make it wrong?
Not sure what to say, you can use the JJ chart if you want, but I would rather use something more up to date using analytical data
NowFromTN:
OK, so does that make it wrong?
Not sure what to say, you can use the JJ chart if you want, but I would rather use something more up to date using analytical data
Well, using the Lions/Cardinals example again… The Jimmy Johnson value chart puts it as
Lions - 1785
So while you claim it to be outdated… It still lines up with what teams are trading
So guess what, look at who the Lions got and look who the Cardinals got then tell me who won that trade.
I don’t claim it to be outdated, just google it and read some articles on value charts
Sheesh, you think I just made this shit up
But it’s not what they used to make the trade, which is my point… They still use the JJ value chart
NowFromTN:
I don’t claim it to be outdated, just google it and read some articles on value charts
Sheesh, you think I just made this shit up
Mk… When they stop making trades that exactly line up with the JJ chart, I’ll admit it’s outdated… Until then, it’s still the standard
Slay
March 15, 2026, 6:23pm
29
NowFromTN:
Here is a good explanation and @Jman is correct, the JJ system is from 1991 and has been or being replaced by these
The Fitzgerald-Spielberger (FS) chart modernizes NFL draft pick valuation by focusing on rookie contract surplus value and on-field production (approximate value) to prioritize mid-round picks, while the Jimmy Johnson (JJ) system , created in 1991, heavily overvalues top-10 picks and is based on historical trade sentiment rather than current statistical analysis
The best trade chart is the ones NFL teams use. I’m fairly sure nobody in the league uses a chart made by the OTC guys, firstly because very few trades balance out using their chart which suggests it isn’t being used, and secondly because some of their analytics are wild (they have Shedeur Sanders as the second most valuable QB in the league https://overthecap.com/valuation ) so anyone should be wary of using any of their analytics tools.
https://harvardsportsanalysis.wordpress.com/2011/11/30/how-to-value-nfl-draft-picks/
Harvard created a trade chart which I suspect might be the ones teams use, just by virtue of the fact that it comes from Harvard.
Slay:
NowFromTN:
Here is a good explanation and @Jman is correct, the JJ system is from 1991 and has been or being replaced by these
The Fitzgerald-Spielberger (FS) chart modernizes NFL draft pick valuation by focusing on rookie contract surplus value and on-field production (approximate value) to prioritize mid-round picks, while the Jimmy Johnson (JJ) system , created in 1991, heavily overvalues top-10 picks and is based on historical trade sentiment rather than current statistical analysis
The best trade chart is the ones NFL teams use. I’m fairly sure nobody in the league uses a chart made by the OTC guys, firstly because very few trades balance out using their chart which suggests it isn’t being used, and secondly because some of their analytics are wild (they have Shedeur Sanders as the second most valuable QB in the league https://overthecap.com/valuation ) so anyone should be wary of using any of their analytics tools.
https://harvardsportsanalysis.wordpress.com/2011/11/30/how-to-value-nfl-draft-picks/
Harvard created a trade chart which I suspect might be the ones teams use, just by virtue of the fact that it comes from Harvard.
OK I will use this one then, sounds fair#13 - 276.8#17 , #118 , #128 - 254+82.6+76.2 = 412.8
Lions would be crazy to do that, again terrible trade value
I read that article and he is using statistical date to come up with his values