So I went through the last 8 years in the MLB. To see the MAJOR discrepancies in team spending.
Because the negotiations next year are gonna get UGLY. And i just happened to notice where the Tigers fell in that list.
But first lets look at the MLB as a whole.
So since 2018.
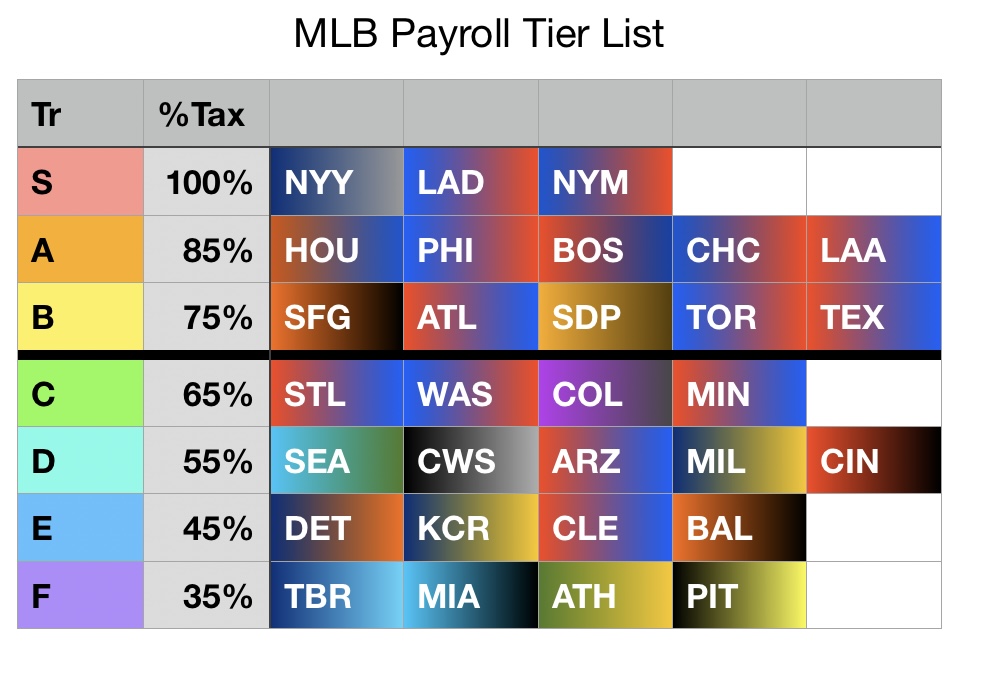
Biggest Spender is no surprise. Yankies. Over $2 billion in spending. And on average are 113% vs the tax cap.
Lowest Pittsburgh. About $565m only about 33% vs the tax cap
MLB average is $1.2 billion and 68.5% vs the tax cap
Which highlights why things are gonna get ugly.
The biggest spender has spent 4x more than the lowest.
But ANYWAY. The tigers.
Only $930m in spending. 23rd in MLB. Averaging about 53% vs the tax cap.
Now 2025 was the highest payroll under Chris tenure at 65.4% so maybe theres hope hell start opening the check book. But i dont feel good about it.
Heres a tier list to give you an idea of where teams stand
Probably learned valuable lessons from the Miguel Cabrera, Jordan Zimmerman, Joe Nathan, Justin Upton, Javy Baez, Victor Martinez, and Adam Dunn contracts.
That is definitely a factor. But even then i would expect them to be in the C tier. Around 65% (which is what they were last year)
But i dont want to hear any excuses from this front office about money. When they have spent $300 million under average the last 8 years! Or about $34m per year! Thats 2-3 very good players they could have had. In other words hes been sitting on that money. Not doing anything with it
Given their financial predilections, the Tigers need to maximize their return on a Skubal trade before next season. The Buddha says expecting a splurge will only lead to suffering.
I’m more interested in how things are trending over the last 2 or 3 years. The Tigers are in a much different spot now than they were 8 years ago. I believe they have been trending up in payroll (not confirmed) over the last 2 or 3 years and hopefully continue that trend with the increased revenues and playoff appearances.