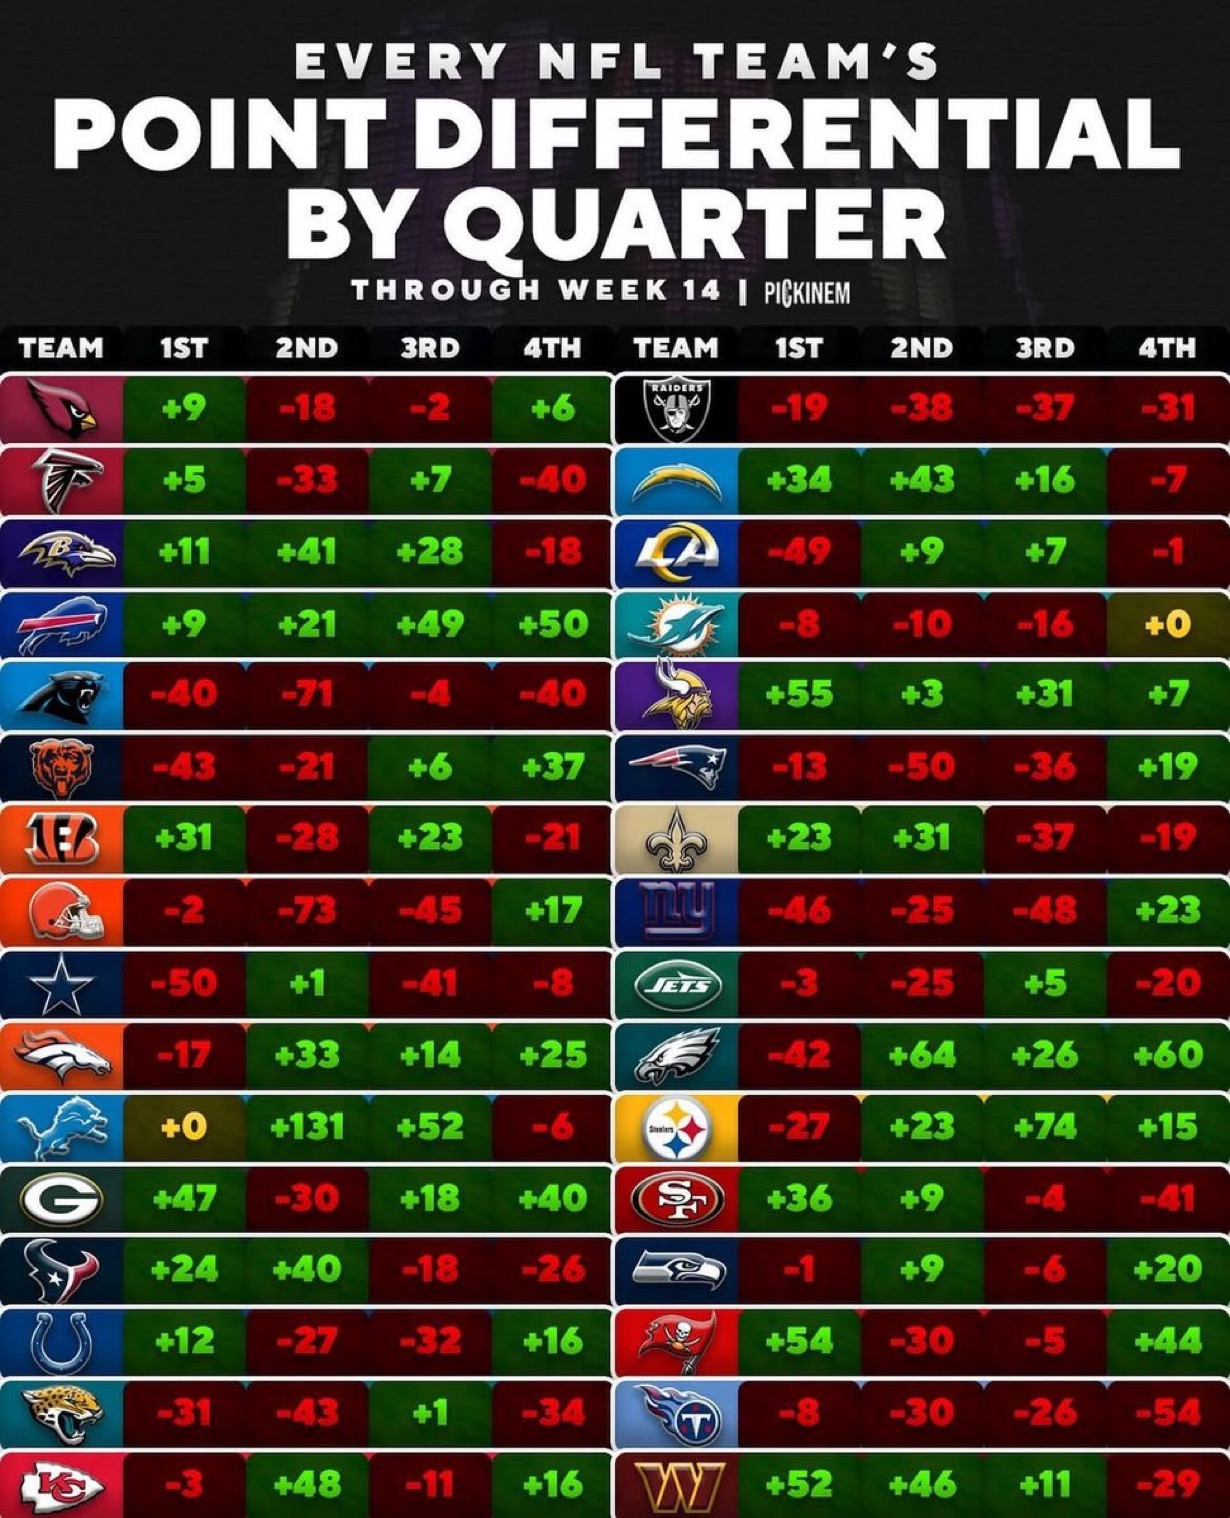
Our +131 for the second quarter is higher than any team over all 4 quarters.
The turd quarter is dead.
Our +131 for the second quarter is higher than any team over all 4 quarters.
The turd quarter is dead.
The bills are the only team with positive differential for each quarter. But if we outscore them by 7 in the fourth quarter and one in the first tomorrow so will we
Philly has been a first quarter under all year. They don’t score shit and their D holds down the opposition.
And the 4th quarter differential doesn’t mean too much cause we have had several massive blowouts, where we just ran out the clock and gave up a few garbage time scores.
Yep. Looking at point differential Lions are run away leaders in this at moment at +183. Bills are second at +129.
Lions have a lot of 4th quarters where it just does not matter and need to run clock out.
Second closest quarter by any team is the Steelers at 74 (3).
The Lions in the 2nd quarter is pretty amazing.
First quarter is a bit suprising to me. Feels
Like we were leading most games by the end of the 1st.
The 4th quarter makes sense since we’re coasting and letting teams back in as we try to burn out the clock. Not to mention injuries mount.
The Bills and Vikes are the only two teams to be + in all 4 Quarters.
First half is also +131. Meaning they average a 10.1 lead at halftime.
Next closest is the Commies at 7.5 at half.
Then Chargers at 5.9
Then houston at 4.9
Everyone else is under 4.5!
Yep, pointed this out earlier, And I think I read somewhere that the second quarter point differential is the biggest all-time.
Its nice to have our former third quarter nemesis behind us now.
I think what this means is simple, if you want to win sporting events SCORE MORE POINTS THAN YOUR OPPONENT.
There is absolutely ZERO value to this data other than what I said above. It doesn’t matter when you score, just score more. That’s it.
I disagree.
Knowing that the Texans were so bad in the second half I felt confident we could come back even though we were down.
There’s a lot of value in that chart.
It tells you how good they are at adjusting.
How consistent they are from quarter to quarter.
How often they are leading games and for how long.
I could go on and on. Lots of information in that chart.
[quote=“Air2theThrown, post:12, topic:39820”]
—-There’s a lot of value in that chart.
For whom, and in what manner? There’s zero evidence that NFL
—-It tells you how good they are at adjusting.
No it doesn’t, the Lions being outscored on in the 4th doesn’t indicate anything about adjustments, it only indicates the other teams are behind by large numbers (as proved by your graph)
—-How consistent they are from quarter to quarter.
What does consistency predict? One could argue the Lions are the most inconsistent team in the NFL. They score very little in the first quarter and the annihilate their opponent in the second quarter, and again in the third quarter they all scored them quite Handley but in the fourth quarter they actually are outs scored on. Again, what does this predict?
——How often they are leading games and for how long.
Again, this contributes zero to predictive analysis and it’s approved by this graph. The 49ers out scored your opponents in both the first and second quarter by wide margin. They are than outscored and the third and fourth quarter, and they have a losing record.
The Cleveland Browns are outscored in the first second and third quarter but they outscore their opponents in the fourth quarter and they’re one of the worst teams in the NFL.
Bottom line, this graph contributes nothing. Unless you can provide a link this information is being utilized as any type of metric for statistical analysis, then I can’t see how it matters. It doesn’t matter when or how a team scores, It just matters that they scored more
Goes to what you were saying in another thread about the scripted plays. It’s like Ben might be overthinking what he expects the defense to do…
This topic was automatically closed 90 days after the last reply. New replies are no longer allowed.