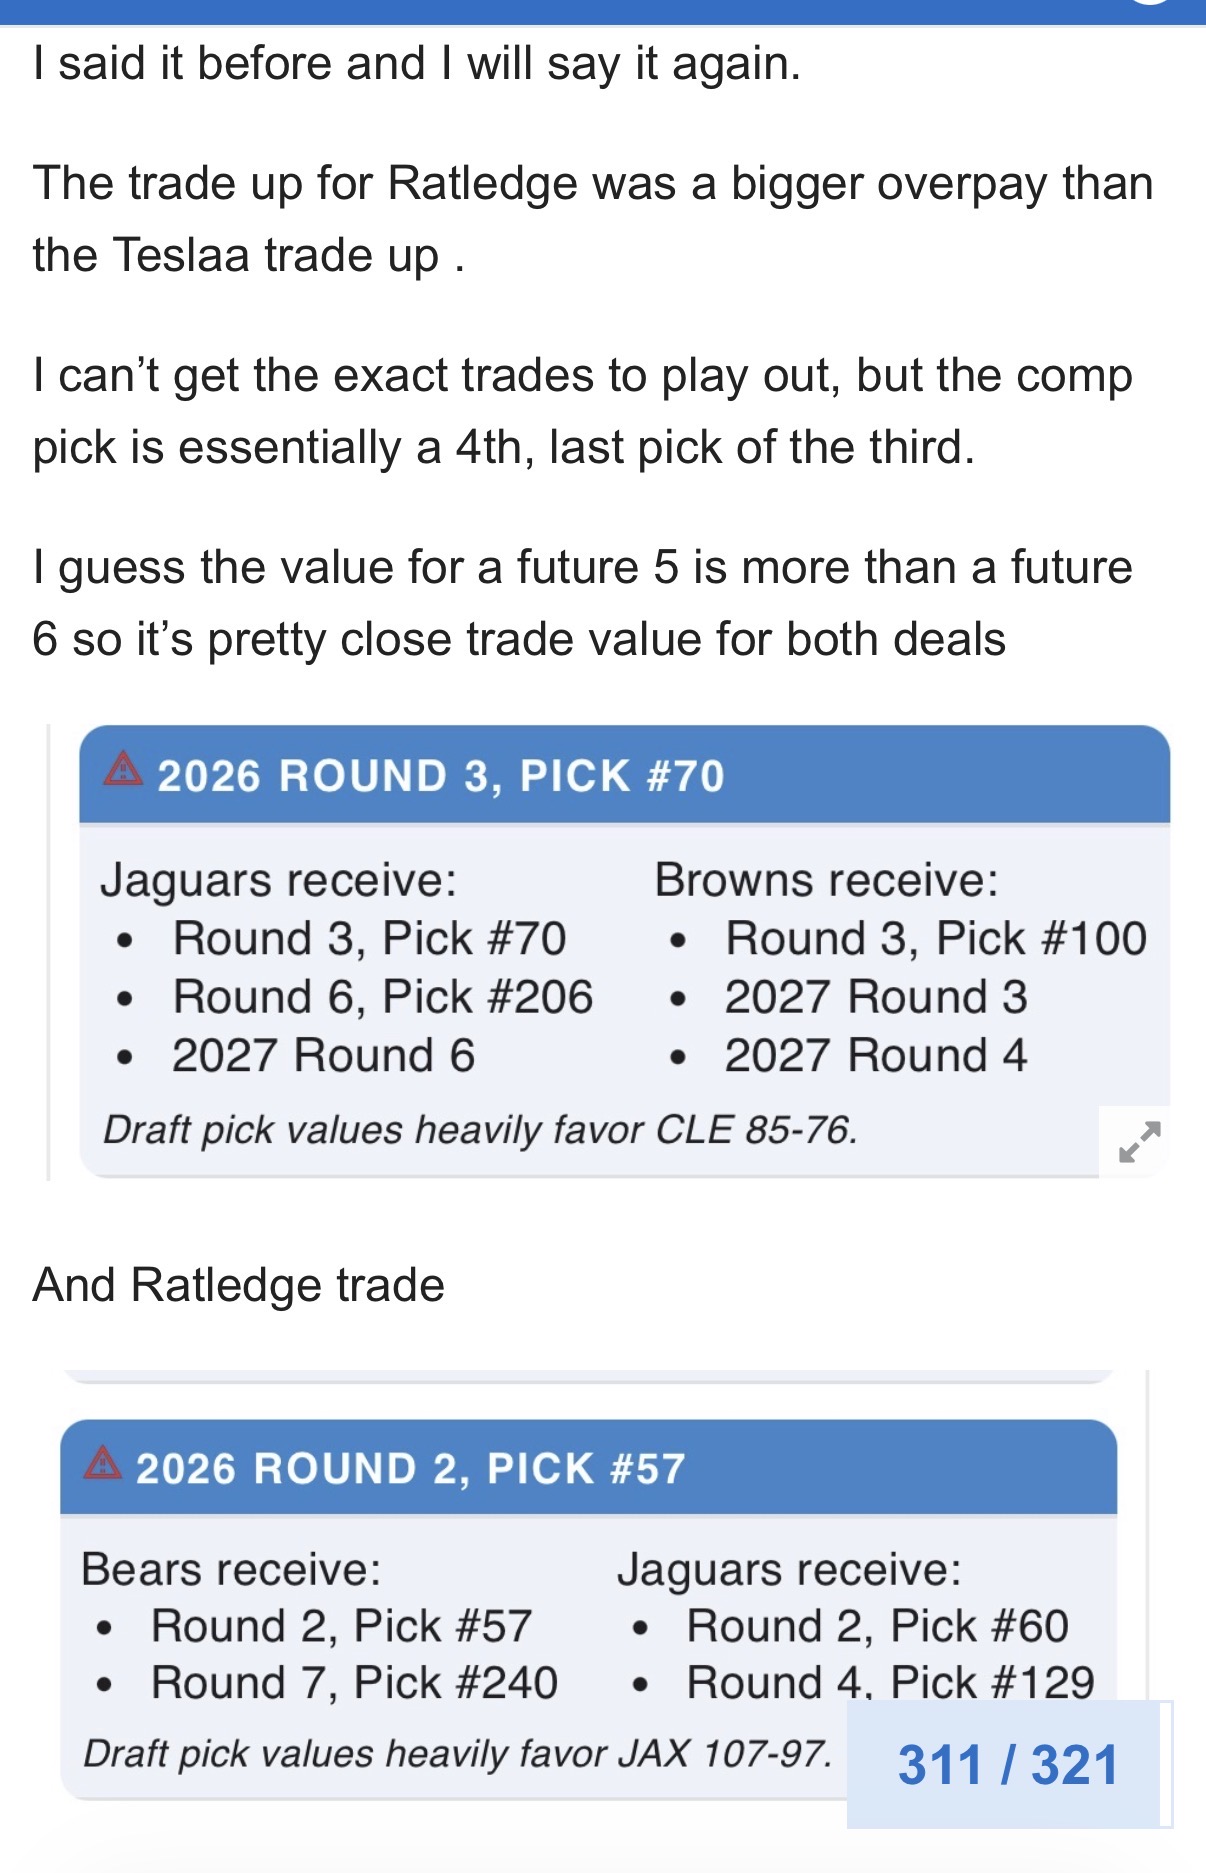
Rich Hill has literally used all of the trades from the past 25 as input to create his chart. This focus on the mean means there will be outliers - even quite a few - but all of that is discussed in the statistical chart above.
You are in fact, so, so right. Right as rain.
(Because if you’re not right neither am I and I refuse to believe that).
1 Like
Lol so now it’s not just one time? I literally proved your statement false in 30 seconds, now I have to do all of them? At least be smart like @Thats2 and say it’s a law of averages instead of a definitive “it only happened once” statement
I feel like the missing piece here might be weight. Meaning all trades are created as equal and it greatly influences the balance at the top half of round 1. Also, it doesn’t take into account factors such as where teams stand in terms of needs/picks.
Another example, the commanders don’t have a 2nd and 4th in this draft. The appeal of getting those imo increases the chances a deal gets done. Data is not taking this into account. So using straight numbers only is misleading (which is a very common theme in statistical data - like going for it on 4th downs without any context at all).
I think using the Hill formula based on past trades is actually a problem rather than “evidence.”
But I could be crazy…
1 Like
Well yeah and trades at the top
Pay the QB tax
Which is why they match up often with JJ chart
That’s part of the problem…data only, no context whatsoever.
In order for a team to drop significant spots in the top 10 or even top 20 they need more compensation. It usually takes you out of a player pool.
Data, although relevant for sure, it’s a bad guideline for things like this. Again that’s just my opinion I guess. It’s a tool, but a baseline only.
Arizona didn’t take a QB when they traded up with Detroit… Seattle didn’t take a QB in the other trade I looked up.
It only happened one time tho… Except every other time it happened

Rich Hill chart is the best guide for data based evidence. It’s certainly not the better of the two imo. But it’s the trendy one because people in the sports world have fallen in love with analytics and take it as facts. Because on one hand, yes they are actual facts. But like everything, context is equally important which data ignores.
3 Likes
If you want to read the full paper, here is the link. They are trying to develop their own chart, which I assume means they don’t think it’s perfect either. And everyone agrees that there is needed context, which is why the 15-30% upcharge when trading up for a QB is such a known thing.
That said, they still did the side-by-side comparison to show that despite its faults, even as a tool or a baseline, it is still much more “correct”, which is the part I clipped and pasted above.
So yes, you are still crazy
4 Likes
I’ll accept that I’m just crazy then haha. Because I’ve looked at every possible trade in the 1st round for years now and the Rich Hill chart falls imo.
Statistics were my thing. Growing up I had a natural connection with math in general. I got it from my dad who is a literal genius. But these deep dive analytics have gotten out of hand. Too much weight has been put into them and it blinds people from the bigger picture. I’m not accusing you of this I’m just stating in general. I’m not using statistical data and charts to make my decisions. I’ll use it as a guideline sure…but the context is what really matters. The data is just a way to make you feel justified with decision making.
1 Like
Want to buy an accounting practice ?!
Yeah I don’t even know how to interpret that.
1 Like
I agree that context matters, but the best statistical studies - as it appears you know - try to take context into account as much as possible (or, to eliminate as many variables as possible). And these guys did this, they even mentioned as much in this part right here:
However, it must be noted that the scales of the two charts are not equal. In the Jimmy Johnson chart, the maximum pick is worth 3000 points, whereas in the Rich Hill chart it is worth 1000 points (also, as noted previously, the “points" in the Jimmy Johnson and Rich Hill charts are two entirely different currencies). As a result, direct visual comparison of the plots may be misleading.
To enable a meaningful comparison between the two charts, a scale-invariant error metric is required. Direct measures such as the root mean square error (RMSE) depend on the magnitude of the underlying scale and therefore cannot be used to compare models expressed in different units. A normalized metric is therefore necessary to evaluate how well each chart represents the empirical trade data.
Which is why they shifted to the relative root mean square error, because it allows for comparisons between models with different scales (as discussed in the paper). These aren’t cherry-picked stats the way they so often are on Twitter or what have you, this is a bona fide study where they’re trying to do the opposite and add as much context and take away as many variables as possible.
Anyway you asked where is the evidence, and I literally gave you a research paper explaining it. I suspect in the history of this board no one has given better “evidence” lol. Whether you agree with it or not, well that’s on you. But the vast majority of all evidence will be statistical, and for all of its faults (and I agree there are plenty), that is still better than the alternative.
And regardless of what you think of basing a model and the actual history that has happened like Rich Hill did, surely you can admit it’s a better approach than the egomaniac Jimmy Johnson trying to do the same thing? One is a statistician, the other is… well, Jimmy Johnson.
1 Like
Nah bro, the most solid evidence is vibes
2 Likes
Yeah that’s not what I’m saying at all, but roll with it…
I almost said it’s better than vibes, rather than the opposite.
I didn’t say you were. I was mostly just making a social commentary joke…you know, where no one cares about actual data and everything is just vibes.
3 Likes
I guess I just don’t put a bunch of stock into statistical data other than a tool to support one’s argument. Maybe that’s why I so often am accused of not coming with supporting evidence and I’m labeled the “vibe guy.”
It appears that I am wrong from a straight statistical/data viewpoint in regards to which chart is more accurate. I mean I can’t argue with that side of it…I guess my stance is more that whatever chart you use, it’s a small part of what makes a trade make sense.
1 Like
You said you are crazy & love math
It’s a good gig for you