Tomlin should be fired for his usage of Nick Herbig alone (I say this as a very frustrated owner of Nick Herbig in a dynasty football league)
1 Like

Not surprising given that the light bulb seemed to go on late last year. He got 1/5m including so I doubt Brad was willing to go that high.
1 Like
so you’re saying miles garrett would be a SUPER easy choice to trade for.
3 Likes
Garrett is a beast
1 Like
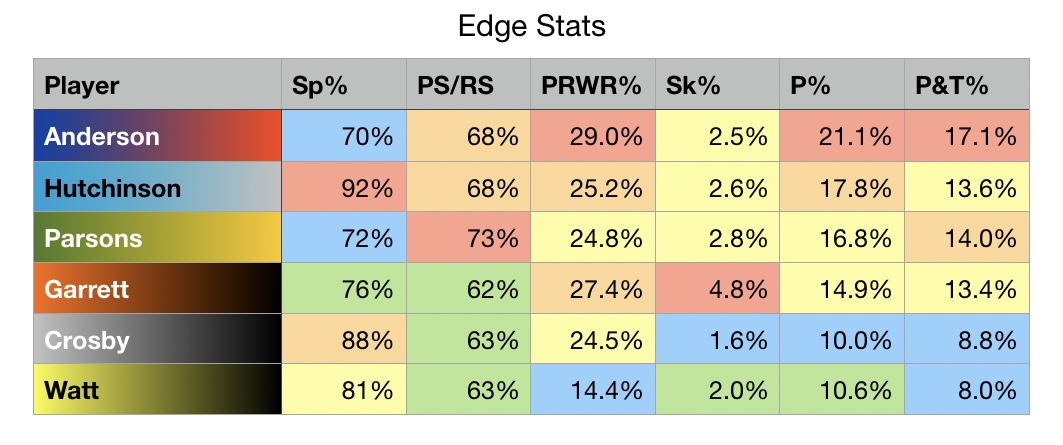
Hutch like he should be more up and to the right based on watching the games… doesn’t feel like he being doubled/chipped any less than Parsons and Myles Garrett.
Problem with that chart. It doesn’t show.
Win rate when 1v1
Win rate when doubled/chipped.
Because i would rather have the guy thats more efficient when doubled vs 1v1 cant tell that here
1 Like
Doesn’t the X axis (“DOUBLE TEAM RATE + CHIP RATE”) show the success vs double team → For example Myles Garrett is at ~60%.
No the X axis is just the rate that the player is double teamed rate.
So Hutch is 45% doubled on every play
11% win rate on every play.
No breakdown of if the win was on single or double
Also Hutchs win rate is lower than Parsons and Garrett
11% vs ~21%
But his pressure rate estimates
Hutch 9%
Parsons 7.5%
Garrett 7.5%
Meaning yes those other guys beat their lineman but dont do anything.
When hutch beats his guy. He gets home
If hutch had a 21% win rate. His pressure rate would be over 18% with 2sk per game
1 Like
Would’ve been a good signing, great call
![]()
Will Anderson has sure turned into a stud. I remember we had many a heated debate on him leading up to the draft a few years ago
4 Likes
AQM
Where is he at ?
2 Likes
Yeah I thought the takes against him were nuts, and I take solace in the fact that Brad apparently loved him and even tried to trade up to get him, but we got trumped by Houston’s crazy offer.
2 Likes
Being that good that early regularly causes silly over analysis.
The other problem with win rate.
Anderson, Parsons, Garret only play ~75% of snaps on defense.
On running downs, they arnt on the field. In favor of a bigger run stopping end
Hutch plays 90%+ of snaps.
So adjusted win rate. If hutch also only played in 75% of snaps. He would be over 15%. Same Watt
So a lot closer on the chart to Parsons and Garrett.
That doesn’t sound right.
Garrett and Parsons beat their guys at TWICE the rate as Hutch even though they’re doubled and chipped at significantly higher rates but somehow have appreciably lower pressure rates.
What would they not “getting home” actually look like? They beat their blockers… and then stop? Doesn’t make sense.
Maybe opposing QBs get the ball out much faster against the Packers and Browns than against the Lions – often too fast for Parsons/Garrett to rack up pressures even when they beat their blockers?
In any case, when it comes to pass-rushing, looks like those two guys - and Anderson and Herbig - are in a different league.
2 things how PRWR can be higher and Pressure rate lower.
1 yes qb gets the ball out before they get there.
DE beats there guy but not close enough to the QB. Qb throws. DE doesn’t touch them.
2 designed plays away from the rusher.
Ie the OL lets the end win. Because the ball is instantly thrown the other way. Like a screen the opposite side
Im also confused.
PFF has aiden at a 25.4% win rate. (Over all)
But ESPN doesnt have him in the top 20. (Under 14%) because ESPN breaks it down by lined up at edge and lined up inside. Aiden does both.